CONSUMER PRODUCTS & SERVICES CLUSTER: SPORTING & RECREATONAL GOODS & SUPPLIES MERCHANT WHOLESALER
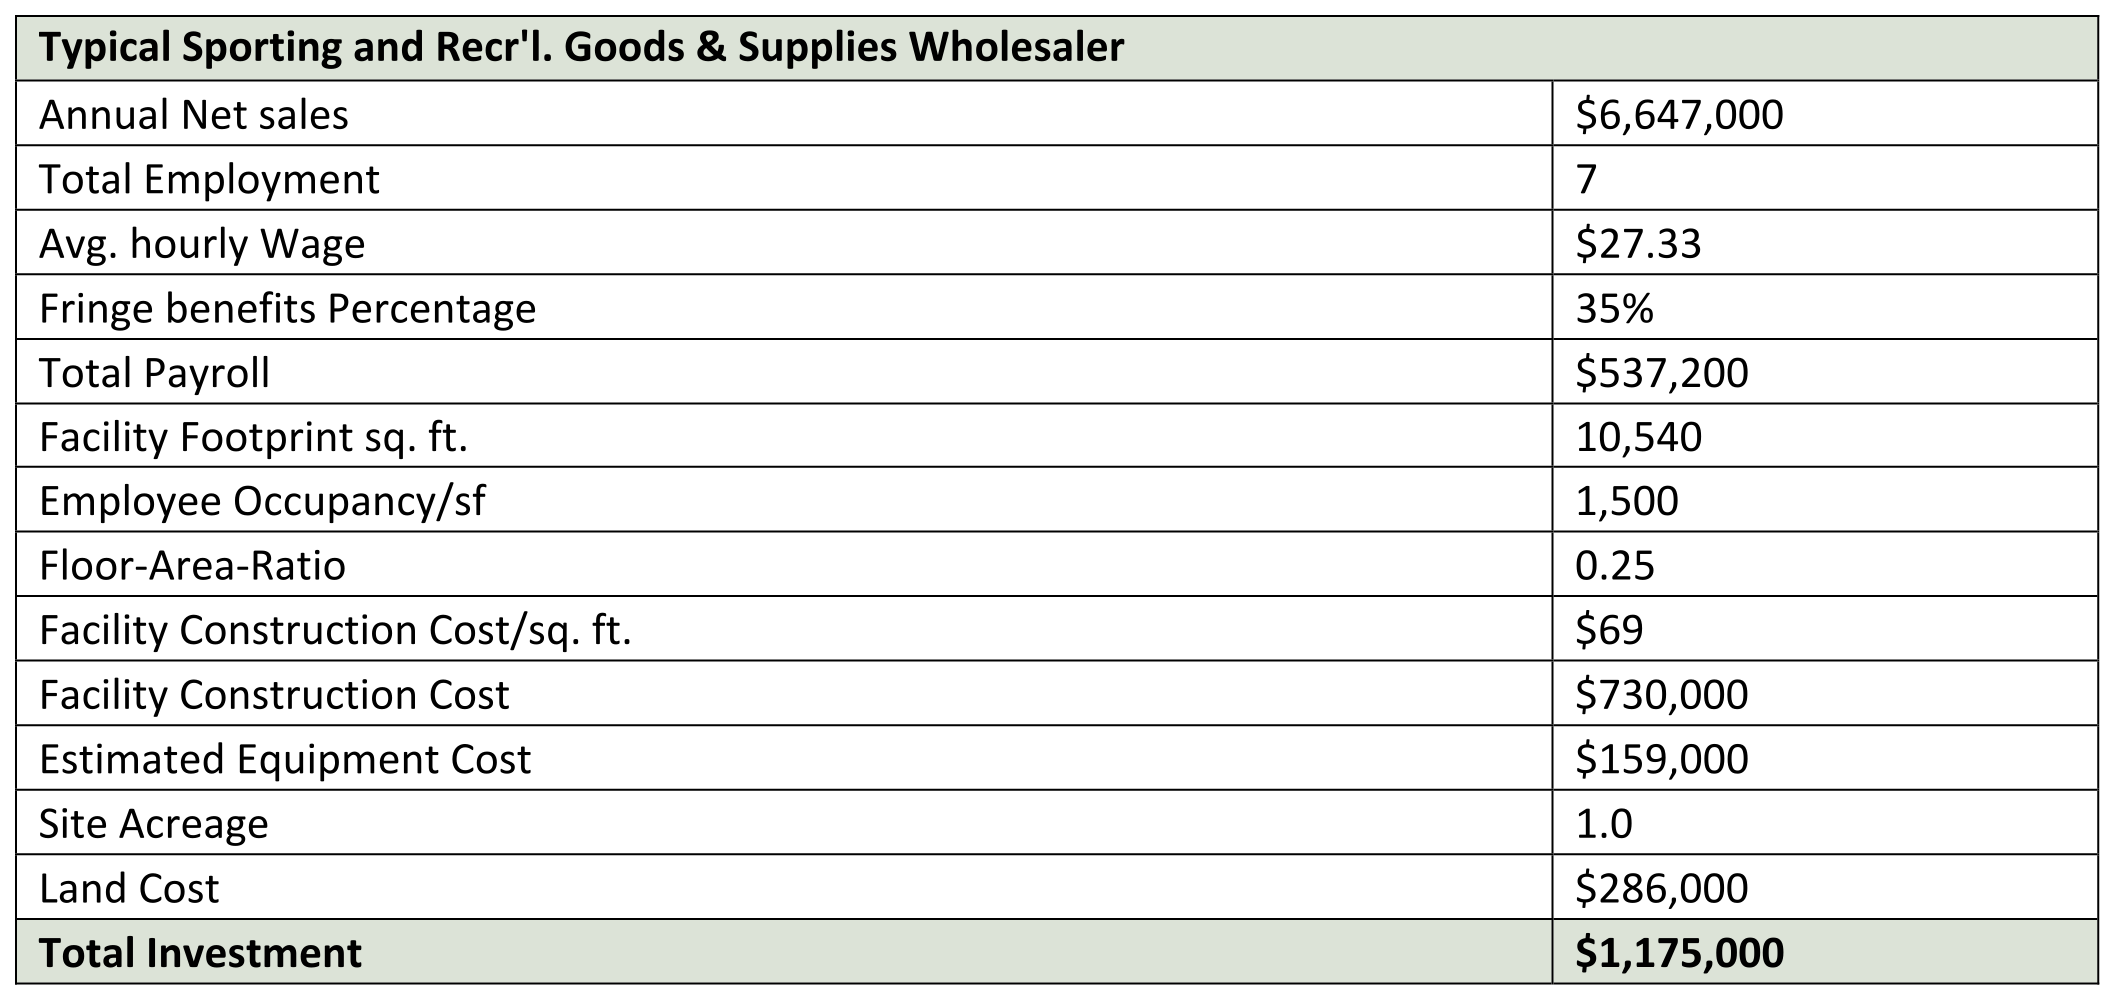
This industry comprises establishments primarily engaged in the merchant wholesale distribution of sporting goods and accessories; billiard and pool supplies; sporting firearms and ammunition; and/or marine pleasure craft, equipment, and supplies. A nominal facility size of 7 persons is selected as a Cape Coral model for this industry. Average productivity output is $946,000 per employee. Total investment per employee is estimated at $167,200, and with the projected gain of 98 new jobs in the industry in Cape Coral, this category could produce an investment of total of $16,386,000 for the City.
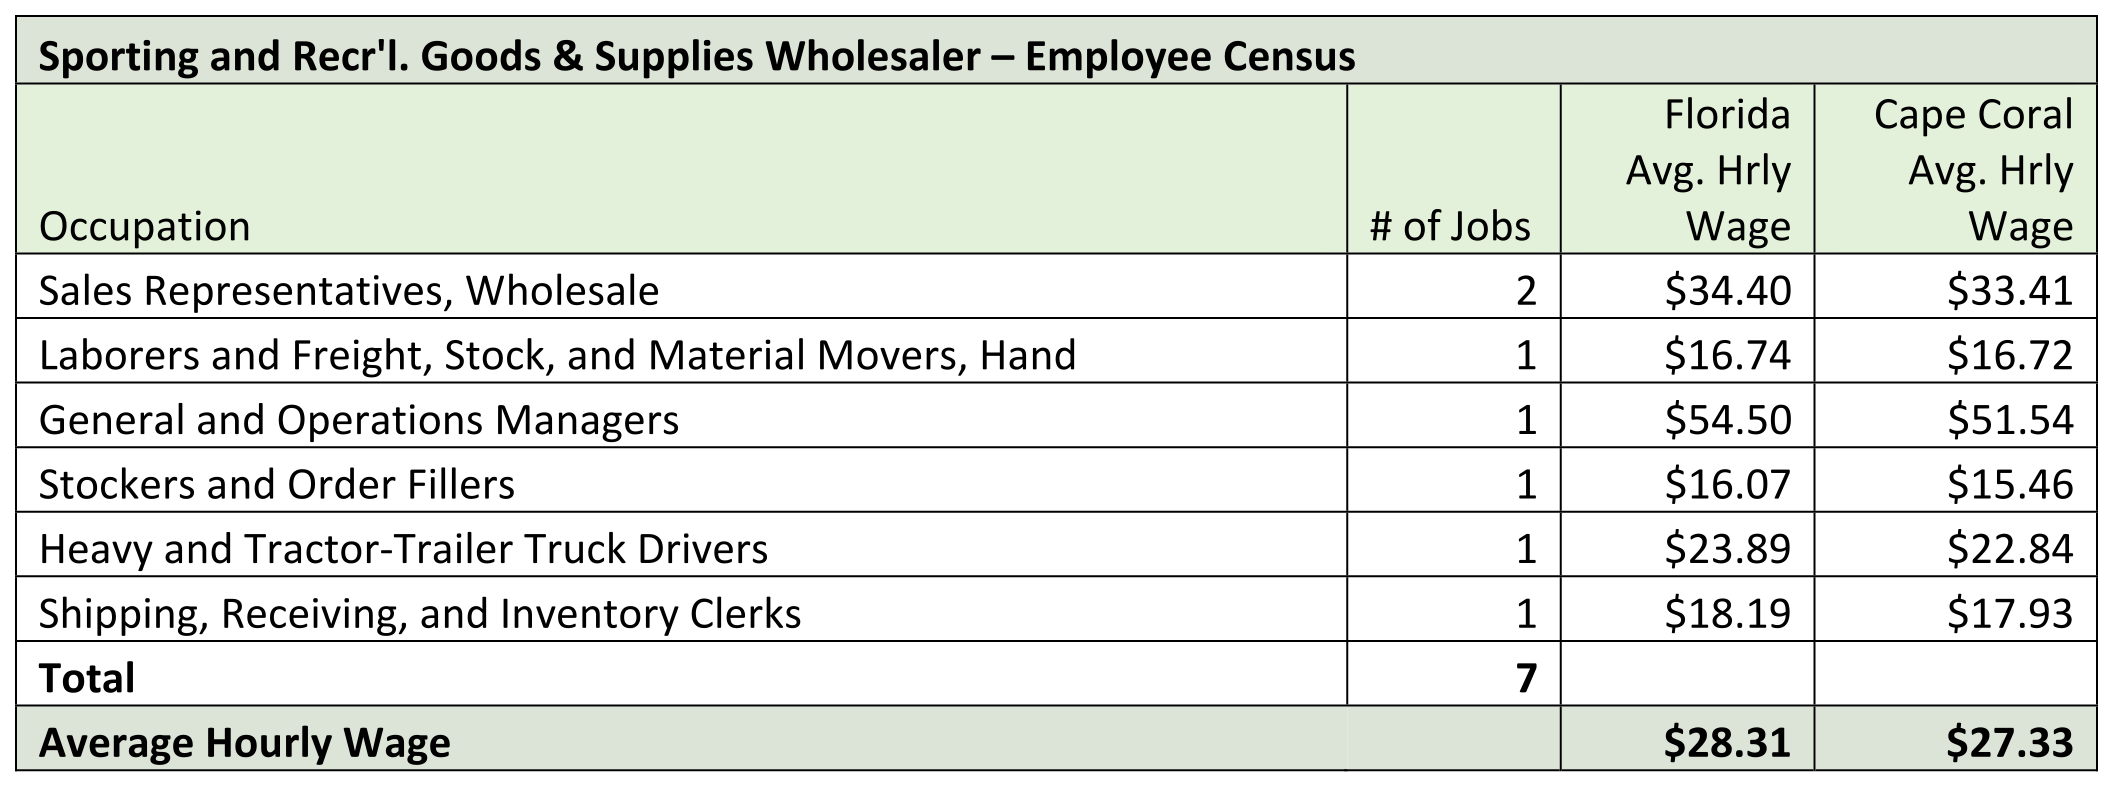
Employment distribution among the relevant major occupational groups for the industry are shown as follows:
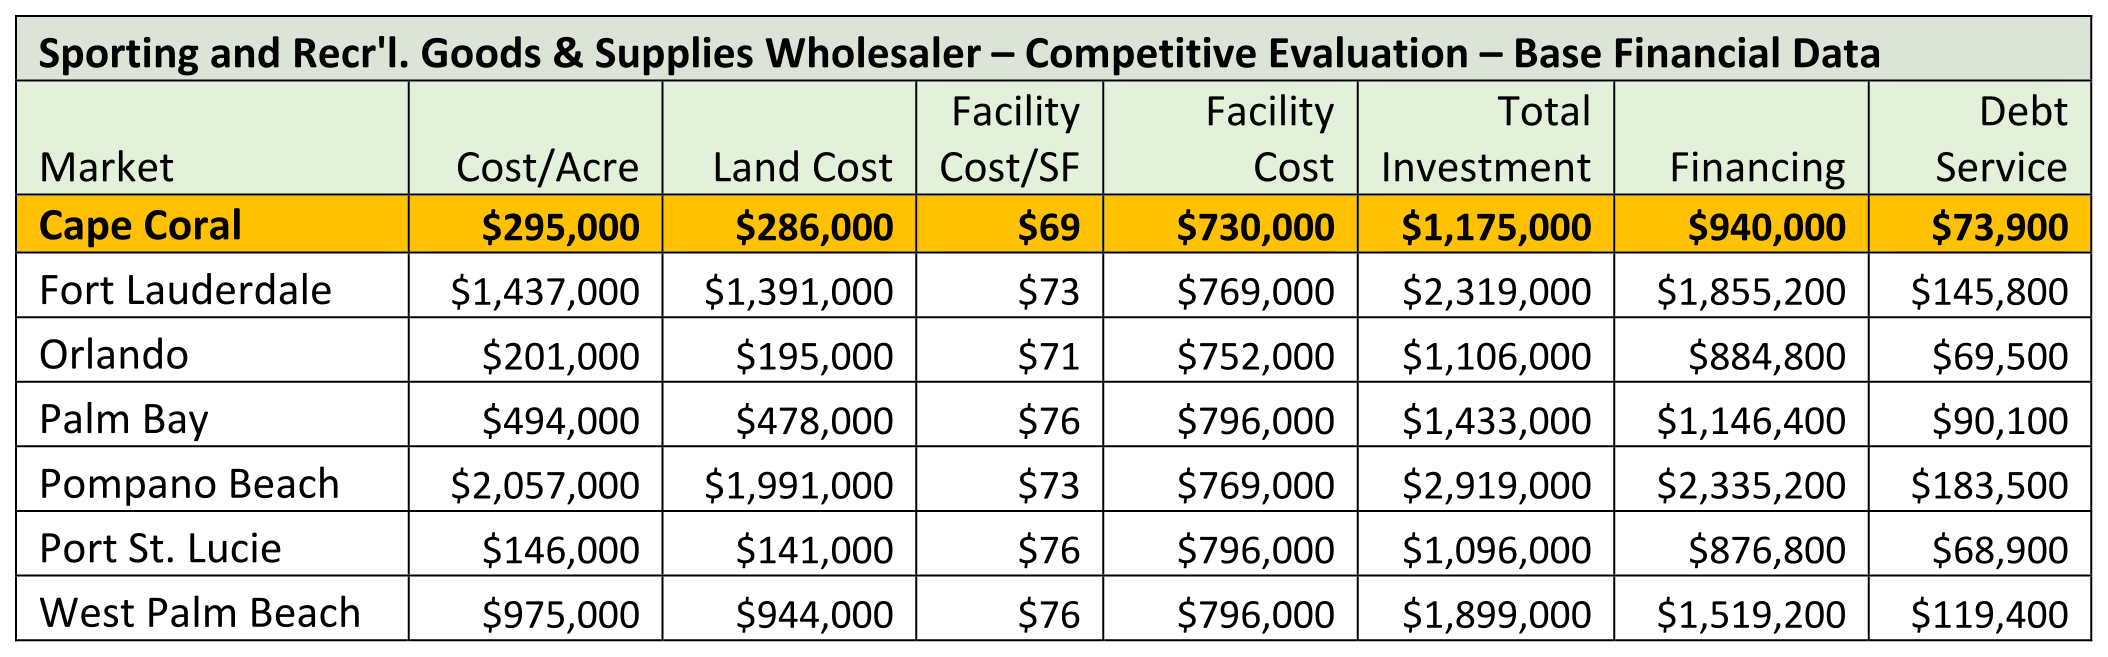
Base financial information is as follows:
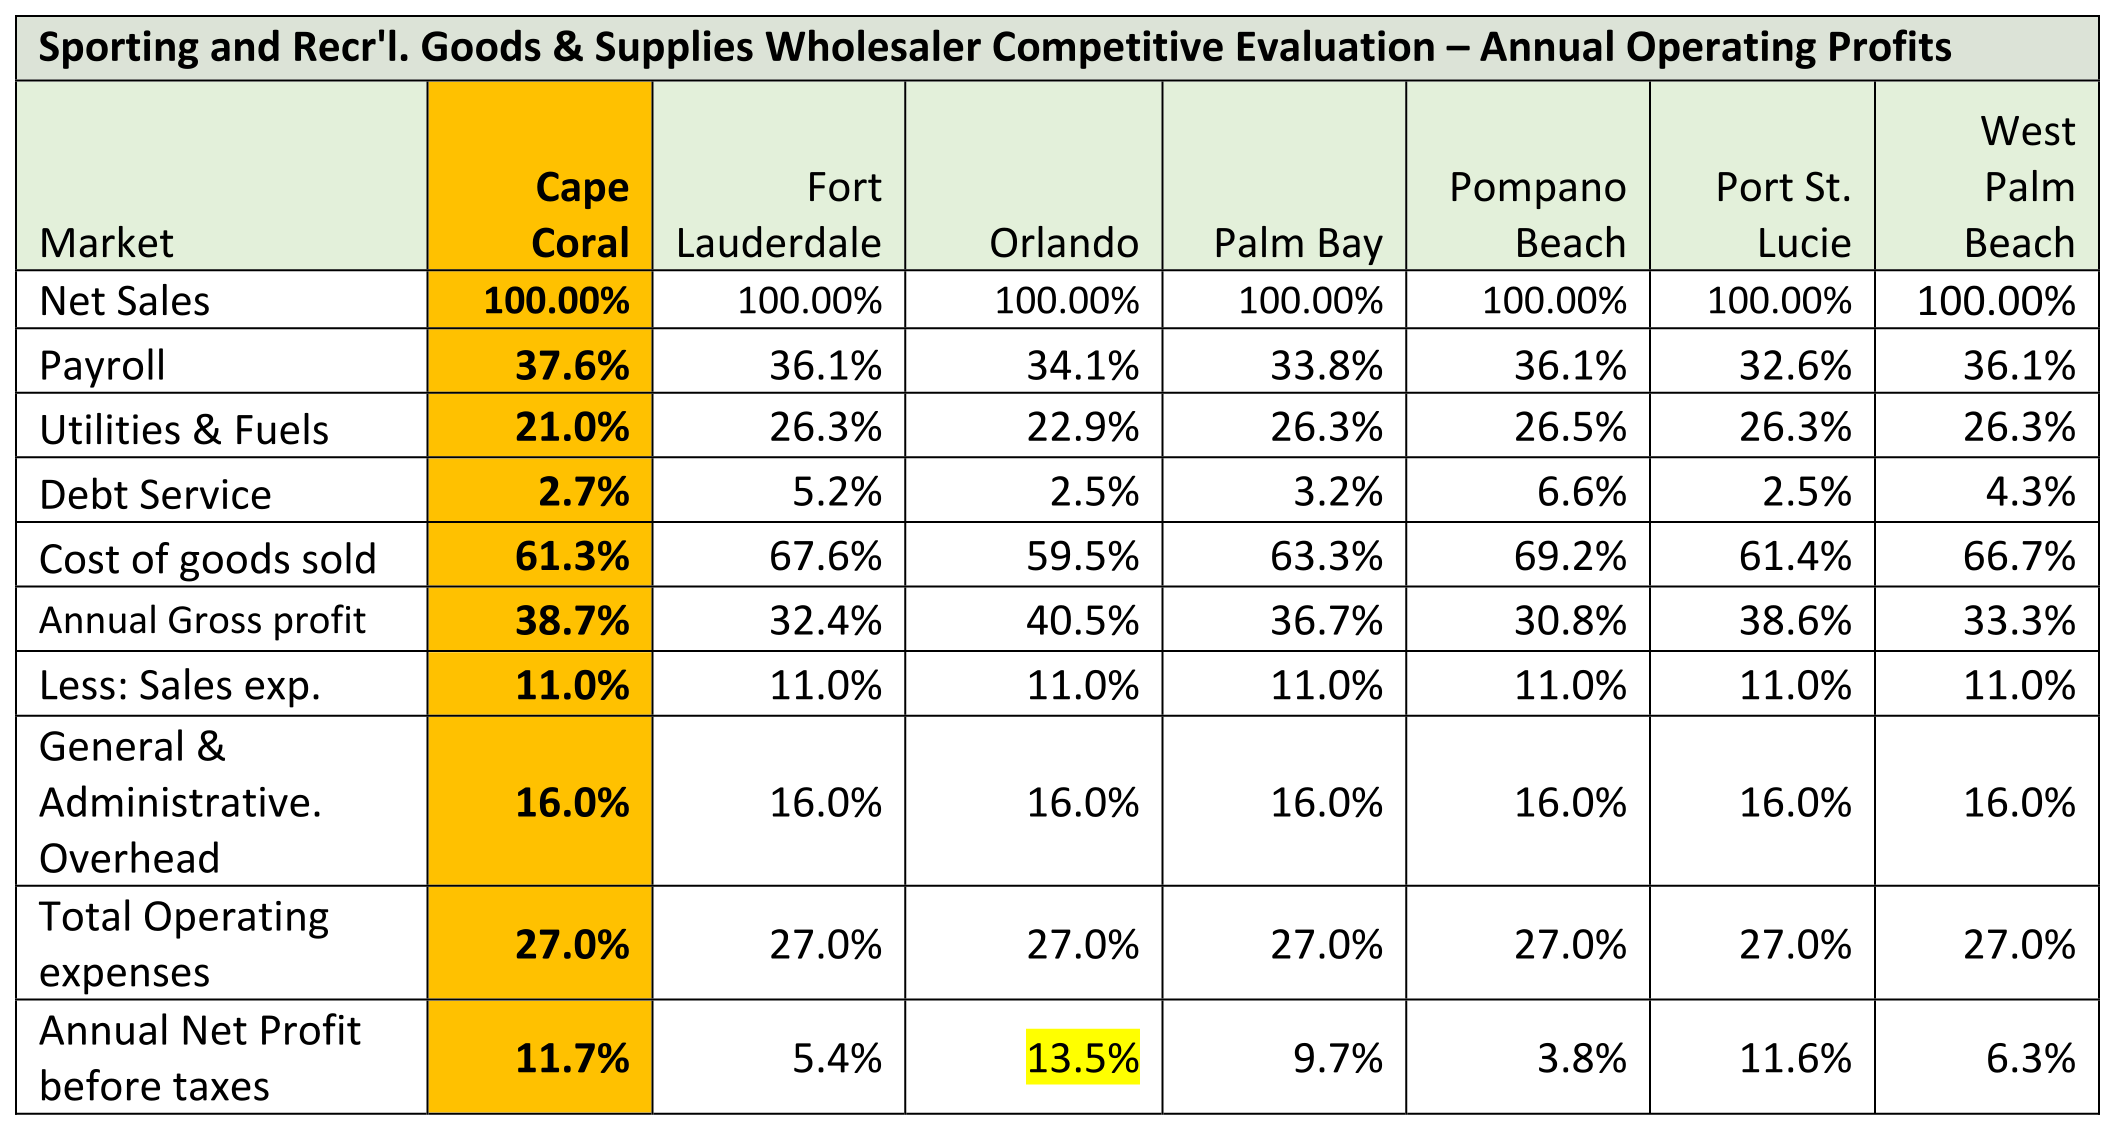
Profitability for Sporting & Recr'l Goods & Supplies Wholesaler in Cape Coral is 11.7%, ahead of all competition except Orlando:
In summary, we do not foresee any positions that exhibit shortfall for Sporting and Recreational Goods and Supplies Merchant Wholesalers. For a potential Cape Coral location, we expect that wholesalers will not experience any significant labor shortages.
COMMUNITY SERVICES CLUSTER: VOCATONAL REHABILITATION SERVICES AGENCY
Since neither the US Census nor the Bureau of Labor Statistics publish employment data on public administration, building an operational model in this category is difficult. In Lee County, the State of Florida operates 50 leased office locations for 19 State Agencies. In total, this covers 312,851 sf of office space. Only 4 of the 19 agencies have a presence in Cape Coral, accommodating only 7,049 sf or 2% of the State’s footprint in the county , as shown in the table below:
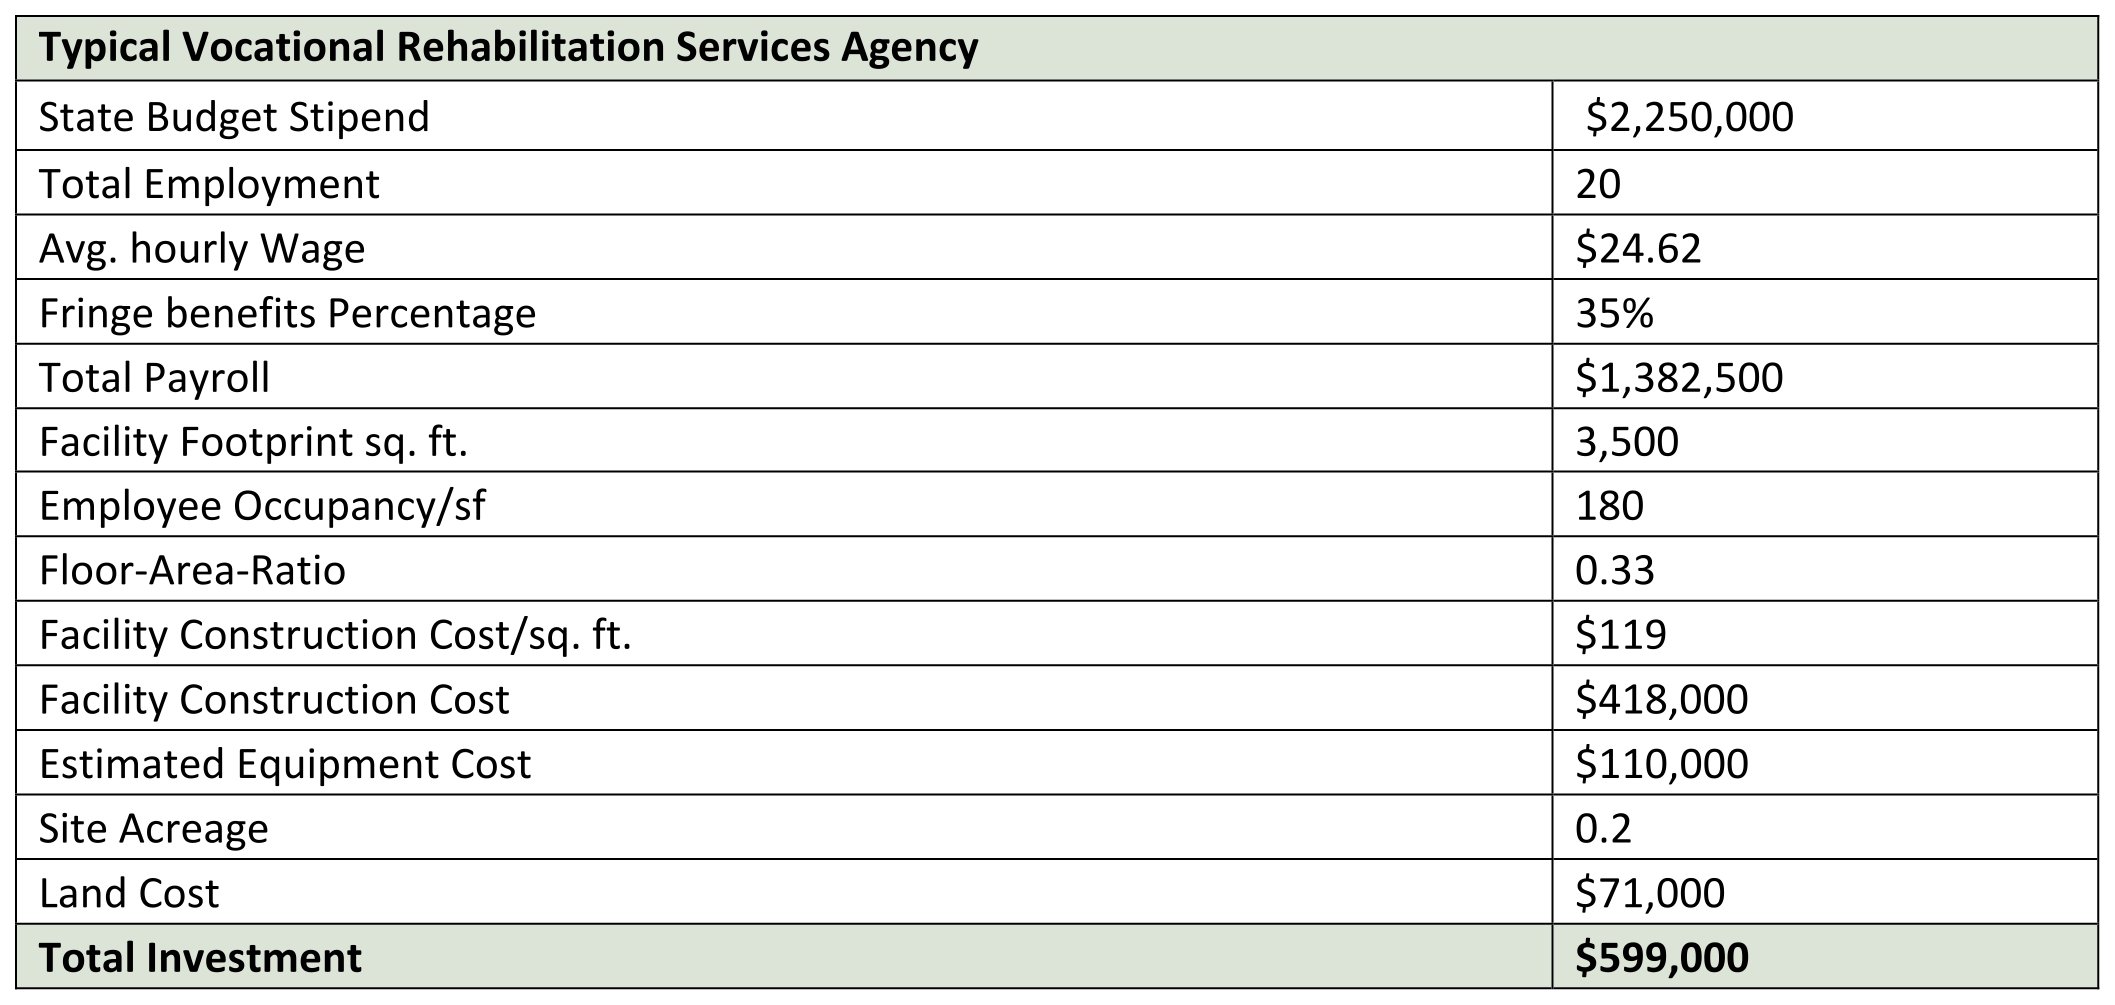
Although a government operation, the metric for this industry comes from the private sector. The private non-profit Vocational Rehabilitation Services industry comprises (1) establishments primarily engaged in providing vocational rehabilitation or habilitation services, such as job counseling, job training, and work experience, to unemployed and underemployed persons, persons with disabilities, and persons who have a job market disadvantage because of lack of education, job skill, or experience and (2) establishments primarily engaged in providing training and employment to persons with disabilities. A nominal facility size of 20 persons is selected as a Cape Coral model for this industry. Average non-profit output is estimated at $115,400 per employee. Total investment per employee is estimated at $30,700, and with the projected gain of 879 new jobs in the industry in Cape Coral, this category could produce an investment of total of $26,985,300 for the City.
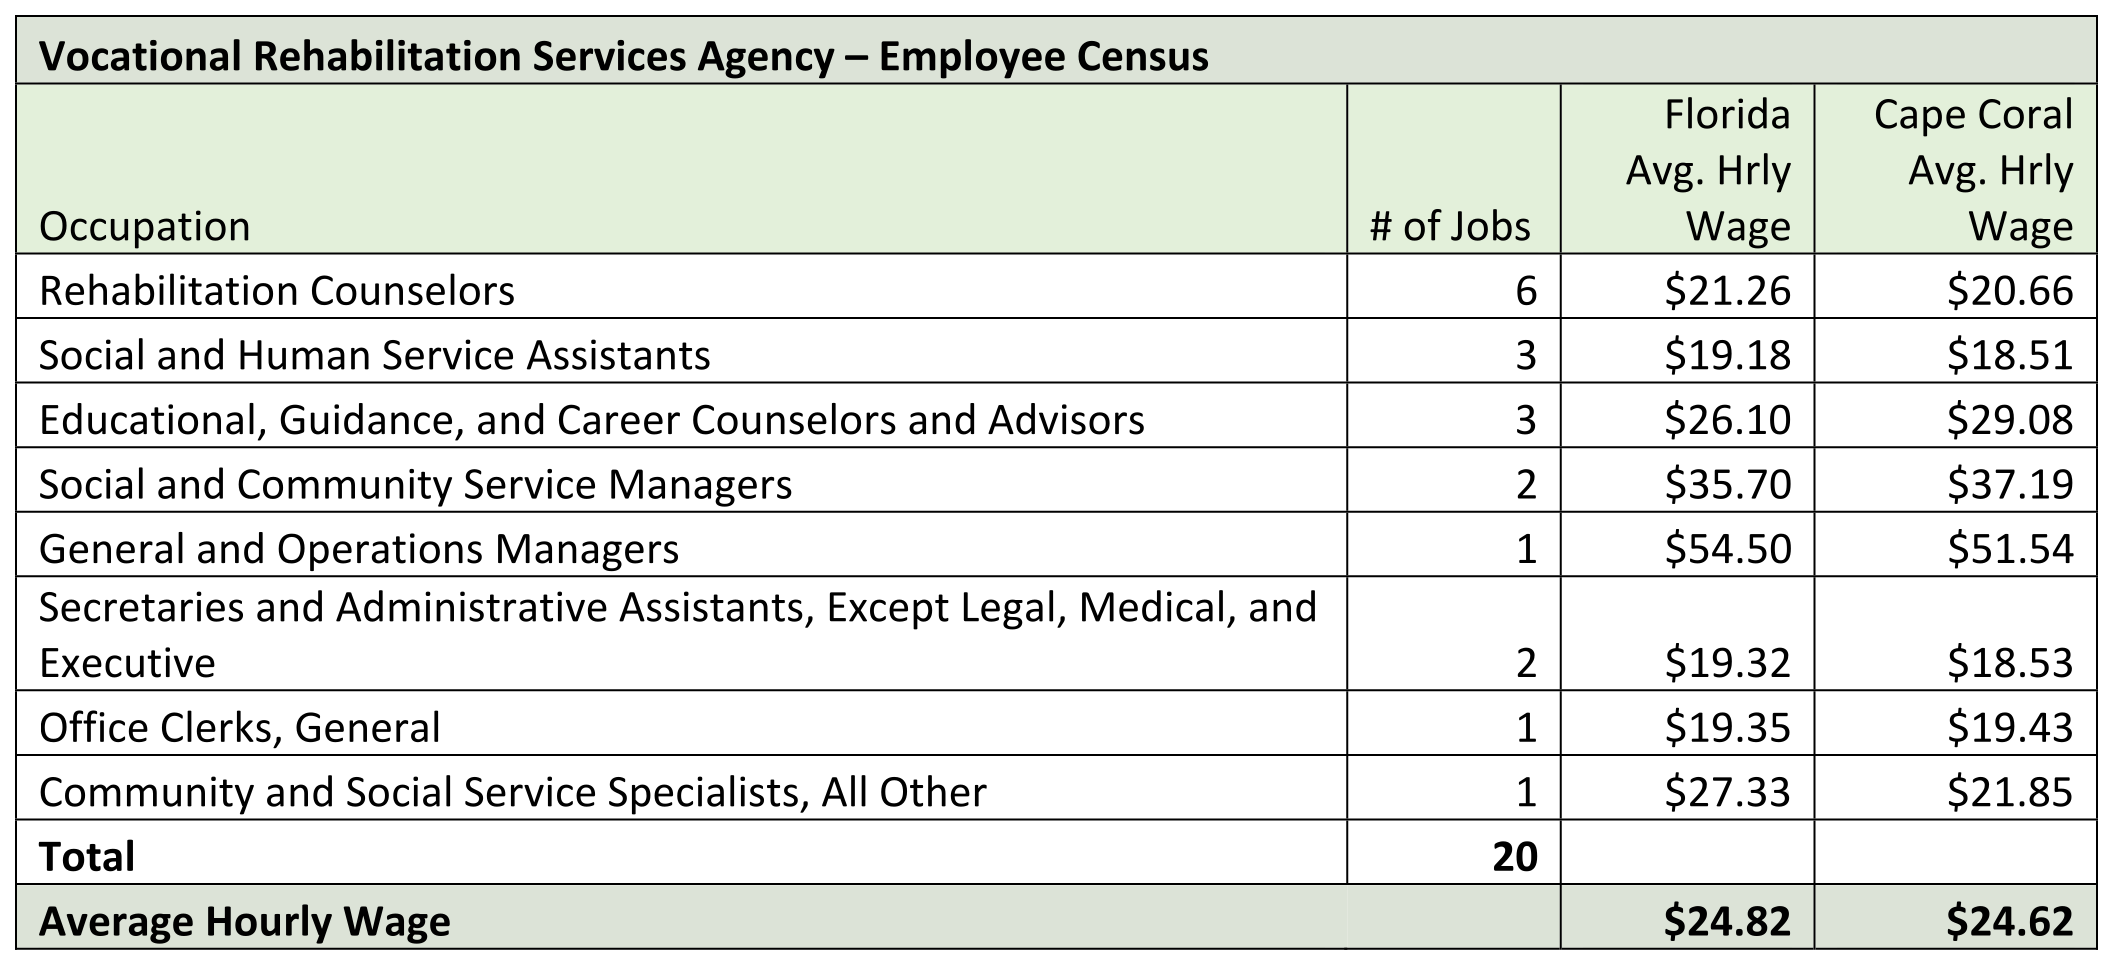
Employment distribution among the relevant major occupational groups for the industry are shown as follows:
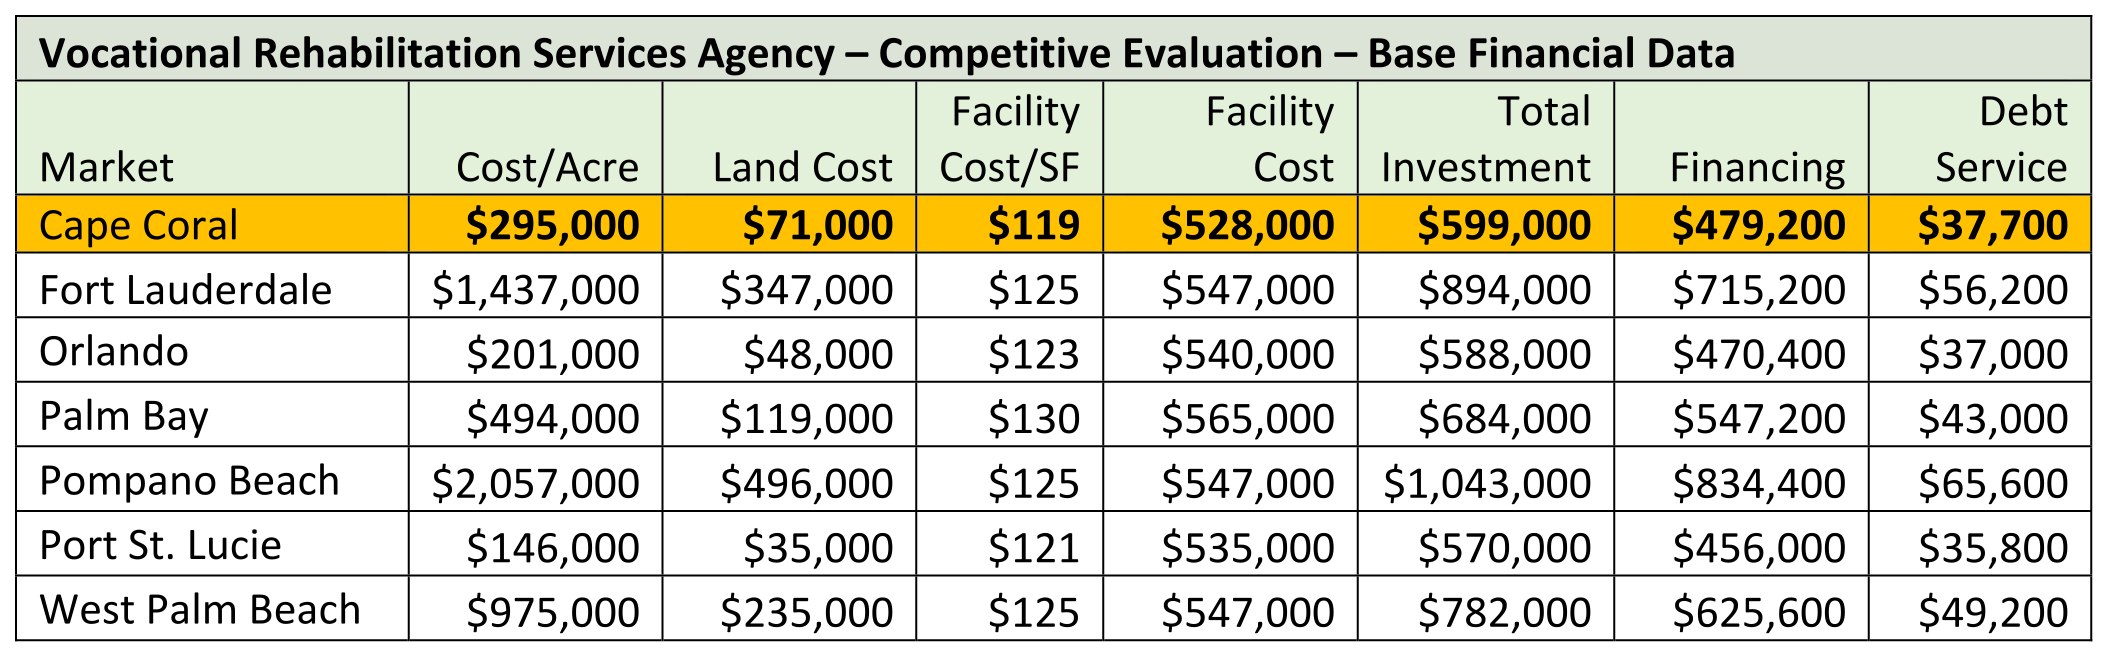
Base financial information is as follows:
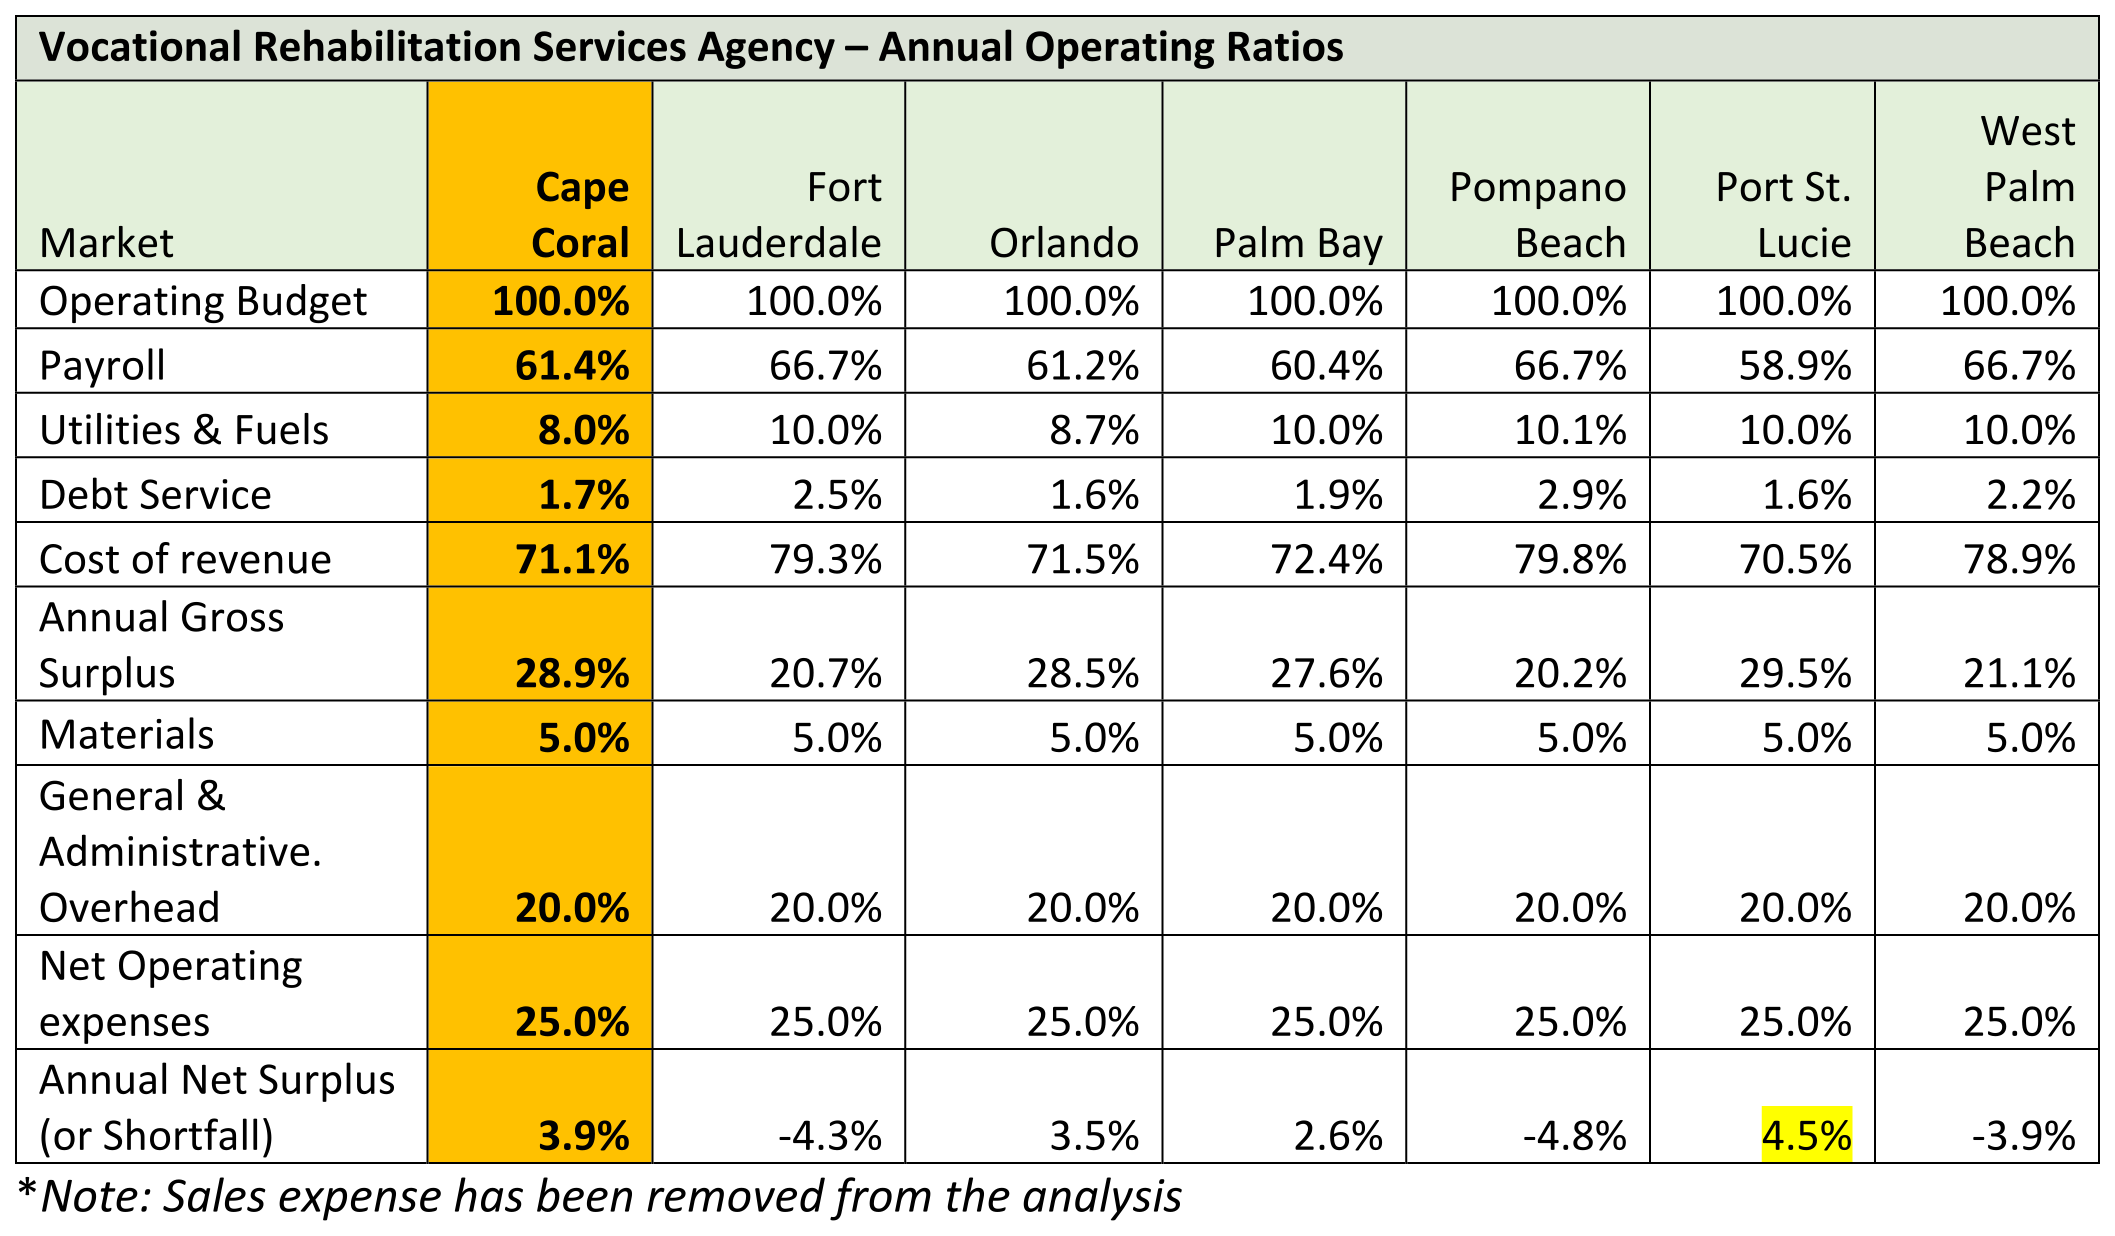
Net Operating Surplus (or Shortfall) for a Vocational Rehabilitation Services Agency in Cape Coral is 3.9%, ahead of all competition except Port St. Lucie:
In summary, the positions that exhibit shortfall for a large Vocational Rehabilitation Services Agency are:
-
- Rehabilitation Counselors
- Social and Human Service Assistants
- Educational, Guidance, and Career Counselors and Advisors
- Social and Community Service Managers
- Community and Social Service Specialists, All Other
A smaller operation is a workable solution, but there may need to be some training and educational strategies needed to address these specialized jobs for a larger operation.
RETAIL REVIEW
To gauge the retail industry’s performance, the generation of a Gap/Leakage Analysis has been the traditional course of action. The surge of online shopping use, however, has made this methodology somewhat obsolete as internet retail has changed the marketplace. Alternatively, we will use 43 retail spending items derived from ESRI’s Retail Outlook distributed in the 8 groups as follows:
-
- Apparel & Services
- Computers
- Entertainment & Recreation
- Food
- Health
- Household Furnishings & Equipment
- Household Operations
- Travel
The initial use of this analysis was conducted in the Econographics Market Profiles developed in Task 2. Here, we will reexamine the retail spending patterns of Cape Coral as compared to the State of Florida, again using the Location Quotient (LQ) methodology. Key sectors are above the median for each category and also above 1.0 parity level.
For Cape Coral’s $1.957 billion total spending on retail in the 43 categories, the following 19 represent the key retail sectors where consumer spending is the highest (ranked by retail spending). Together they total $1.272 billion or 65% of the Cape Coral consumer spending pattern:
From the above list, it is apparent that Women’s’ Apparel (LQ=3.580) and Footwear (LQ=2.927) are dominant categories by virtue of their high LQ scores. Cross-marching these two segments against the Consumer Products & Services cluster reinforces the role of NAICS 4581 - Clothing and clothing accessories retailers and 4582 - Shoe retailers in the cluster assignment.
Please note that 6 other categories exhibited above median performance but where still below the 1.0 parity level for the State of Florda in the LQ methodology. These are areas of minor concern for Cape Coral but should be addressed:
-
- Housekeeping Supplies
- Furniture
- Children's Apparel
- Toys/Games/Crafts/Hobbies
- School Books and Supplies
- Housewares
ASSITANCE PROGRAMS REVIEW
In this section, we will introduce state and local assistance programs that may have a bearing on cluster development and prioritization. A more detailed review will occur in Task 5 – Incentives.
State of Florida
The state of Florida offers a number of assistance incentives for business. These include:
-
- Capital Investment Tax Credit (CITC)
- Research and Development Tax Credit
- Quick Response Training (QRT)
- Incumbent Worker Training (IWT)
- Brownfield Redevelopment Bonus
- High Impact Performance Incentive Grant (HIPI)
- Community Contribution Tax Credit Program (CCTCP)
- Research and Development Tax Credit Program
- Rural and Urban Job Tax Credit Programs
Sales tax exemptions cover:
-
- R&D Equipment (Predominant Use))
- Semiconductor, Defense, and Space Technology Production Equipment
- Manufacturing Machinery and Equipment and Subsequent Labor, Parts, and Materials Used to Repair Equipment
- Electricity Used in the Manufacturing Process
- Clean Energy
- Aircraft Expenditures
- Spacecraft Expenditures)
Southwest Florida Planning Council (SWFPC)
The Council does not provide direct financial assistance, but important studies such as the Cape Coral Climate Change or the Evacuation Study can have direct impacts on targeted industry clusters sustainability.The SWFPC is helpful in promoting the region through projects it initiates on key subjects. Among these are:
-
- Resiliency & Climate Change Projects
- Ecosystem Services Projects
- Sustainable & Equitable Agricultural Projects
- Covid Recovery & Resiliency
Lee County
-
- Industrial Development Revenue Bonds (IDRBs): long-term, tax-exempt, low-rate financing of capital requirements for new and expanding manufacturing facilities in Lee County
- Gold Key Grant Program: financial assistance to small businesses leveraging in the US Commercial Services Gold Key Matching service
- Opportunity Zones: temporary, step-up, or permanent deferral of inclusion in taxable income for capital gains reinvested into an Opportunity Fund
City of Cape Coral
The City of Cape Coral has some interesting programs that we will explore in greater detail in Task 5. Recommendations to modify these to better address the target industry clusters will be made:
-
- Breaking Barriers to Business (B2B) Program
- Ad Valorem Tax Incentive Program
- Business Infrastructure Grant
- Cape Collaborates - Small Business Partner Program
- Enhanced Property Value Recapture Grant
Incubators & Accelerators
The development of business incubators nationwide has proven to be benefit to startup companies, with about 87% survivability after five years as compared to 44% without such assistance.
Typically, a business incubator helps to develop and refine high-potential startup ideas. Incubators often operate locally and provide a host of resources—such as physical space to access as needed—over a span of one to five years.
A recent addition to incubators are Accelerators -- short, intensive programs that provide education, resources, and mentorship for early- or mid-stage companies. Accelerators are normally more structured and feature specific tracks to turn startup into a scalable business. Some offer multiple programs targeted at different industries or venture stages.
Examples of successful Incubator and Accelerators in Florida include:
-
- Culinary Accelerator @ Immokalee -- members may select from a range of customized hours and plans to prepare, cook and package their culinary creations for distribution
- TEC Garage (Tampa Bay Innovation Center) -- home to independent workers including solo entrepreneurs, lawyers, investors, accountants, graphic designers, engineers, and other related occupations geared towards tech startups. The space is great for small companies, remote workers, startups and anyone who wants to share ideas, knowledge, space and equipment
- Goldstein Business Accelerator (Orlando) -- provides access to $100,000 in seed funding, mentorship from a seasoned pool of knowledgeable experts and introductions to angel investors and venture capitalist firms
- Miami Lab Ventures: a Venture-capital fund and startup studio dedicated to accelerating real estate and construction technology industries
Conclusions
It is possible that companies in the targeted industry clusters may need some degree of financial incentives to consider a Cape Coral location. These could be across industry programs or more tailored to individual companies. We examine the role of incentives more thoroughly in Task 5. Clearly, the development of incubators and accelerators will have a key role in successful cluster promotion. In the meantime, we are excited by the advantages that Florida offers to prospective employers. As displayed on multiple economic development websites, these advantages reinforce the following:
-
- No Corporate Income Tax on limited partnerships
- No State Personal Income Tax
- No Corporate Franchise tax on Capital Stock
- No State-Level Property Tax assessed
- No Property Tax on Business Inventories
- No Sales Tax on Manufacturing Machinery & Equipment
- No Property Tax on Goods-in-Transit for up to 180 days
- No Sales Tax on Purchases of Raw Materials Incorporated in a Final Product for Resale, including Non-Reusable Containers or Packaging
- No Sales/Use Tax on Co-Generation of Electricity
- No Sales and Use Tax on Goods Manufactured or Produced in Florida for Export Outside the State
The target industry clusters presented will next be evaluated for economic development administration, incentives, real estate and infrastructure requirements, and workforce education. To recap, the new Cape Coral target industries are:
-
- BUSINESS & FINANCIAL SERVICES
- COMMUNITY SERVICES
- CONSUMER PRODUCTS & SERVICES
- CULINARY TOURISM
- HEALTHCARE & LIFE SCIENCES
- INDUSTRIAL SERVICES
- IT & MEDIA
- SUSTAINABLE REAL ESTATE
The 13,640 forecasted total employment for the 8 targeted industry clusters will produce a total of 15,162 new jobs (direct, indirect, and induced) and an annual total economic impact of $3.358 billion, as shown in the table below:
3.e Task 3 Progress Report/video conference
We conducted a video conference with the Project Review Committee on January 24, 2024. Work product to date was discussed and the materials covered were previously uploaded to the website.